Keep track of specific open ports on your server and ensure services are available at all times.
Set up monitoring in just a few steps.
Step 1
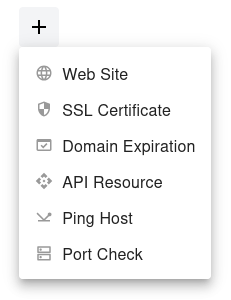
Open the dashboard, click the  button, and select Port Check from the dropdown menu.
Step 2
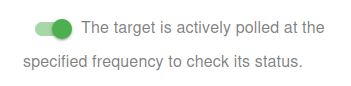
Choose whether to activate the monitor immediately or keep it paused for now:
- Active: The target is actively polled at the specified frequency to check its status.
- Paused: The target is temporarily inactive and will not be polled until set to active again.
Step 3
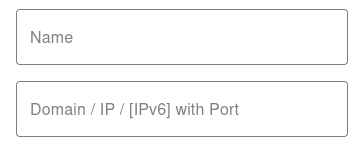
Set the Name and the Domain or IP (IPv4/IPv6) with Port for your target. The Name will appear in alerts, reports, and notifications.

You have now set the minimum required settings to start monitoring your resource/target.
The next steps are optional.
If you click Save, our bots are ready to start scanning and monitoring your site
Scan Frequency (Up/Down Monitoring)
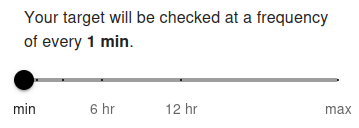
Your target port will be checked at a frequency of every 5 min by default. The minimum allowed frequency is 1 minute and the maximum is 24 hours.
The scan frequency determines how often your server port is tested for availability. Setting a shorter interval (e.g., 1 minute) allows you to detect service interruptions almost instantly. For free users, the minimum frequency is typically 5 minutes, while premium users can set it to 1 minute for near real-time monitoring. Frequent checks are recommended for critical services (e.g., databases, SSH, or custom application ports) to ensure fast alerting.
Longer intervals (e.g., 1 hour or more) are suitable for non-critical ports or services where immediate notification is not required. Choose the frequency based on how critical the monitored port is and how quickly you need to respond to potential downtime.
Advanced Settings
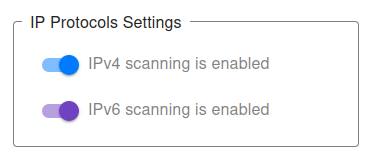
IP Protocols Settings
You can choose which IP protocols to use when monitoring your target port. By default, both IPv4 and IPv6 are allowed, and the monitoring bot will decide automatically which protocol to use.
-
IPv4 only – All port checks will be performed using IPv4.
Example:
1.2.3.4:22(IPv4 address with port) will only allow IPv4 checks. -
IPv6 only – All port checks will be performed using IPv6.
Example:
[2001:db8::1]:443(IPv6 address with port) will only allow IPv6 checks. - IPv4 + IPv6 (default) – Both protocols are supported, and monitoring will work for any valid domain with a port.
👉 If you provide a direct IP address with port (e.g., 1.2.3.4:3306 or [2001:db8::1]:25), the system automatically restricts monitoring to that protocol type (IPv4 or IPv6).
👉 For hostnames with ports (e.g., example.com:8080), you may explicitly choose to monitor only via IPv4 or only via IPv6.
This can be useful for:
- Testing whether your service port is accessible via both protocols.
- Ensuring IPv6 readiness for specific services (e.g., HTTPS on port 443, mail on port 25).
- Debugging connectivity or firewall issues tied to one protocol type.
For most cases, we recommend keeping the default (IPv4 + IPv6) setting, ensuring maximum compatibility and availability of your service ports.
Notification Settings – Choose how you want to receive alerts
How would you like to be notified?
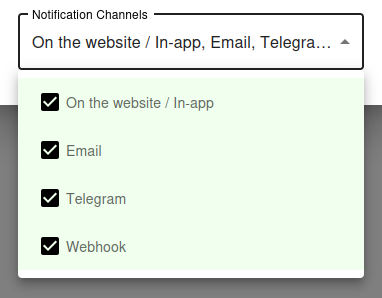
By default, all available notification channels are enabled:
- On the website / In-app
- Telegram
- Webhook
You can customize which channels to use for this monitor individually, or globally manage permissions for Email, Telegram, and Webhook notifications via your Notification Channels settings.
✅ Recommended: Keep all channels enabled for maximum awareness of uptime issues, but adjust according to your preferences and workflow.
Why Port Monitoring Is Essential
Beyond HTTP - Tracking Real Service Health
HTTP monitoring is great for websites and web APIs, but most production infrastructure runs services that do not speak HTTP. Databases listen on their own ports, mail servers use SMTP and IMAP, SSH listens on port 22, game servers use custom UDP ports, message brokers expose their own protocols, and so on. For all of these, ICMP ping is too coarse and HTTP monitoring is irrelevant. The right tool is port monitoring.
A port check confirms that the service is not just running on the host, but actually accepting connections on the expected port. That extra layer of verification catches problems that ping cannot - for example, when the host is alive but the application has crashed and the port is no longer bound.
Catching Service Failures Quickly
When a service crashes, the operating system continues to respond to ping. The host looks healthy from a network perspective even though no clients can actually connect. Port monitoring catches this immediately by attempting to open a TCP (or UDP) connection to the specific port. If the connection is refused, timed out, or otherwise rejected, the monitor reports the service as down.
For mission-critical services like databases, mail relays, and authentication systems, this is the difference between detecting an outage in 30 seconds versus discovering it when the next user complains.
Common Ports to Monitor
Web and API Services
- 80 (HTTP) - Plain web traffic
- 443 (HTTPS) - Encrypted web traffic and most modern APIs
- 8080, 8443 - Common alternative web ports for development and admin panels
- 3000, 5000, 8000 - Default development server ports for Node.js, Flask, Django
For HTTP/HTTPS, full HTTP monitoring usually provides more value than a simple port check, but a port check is useful as a lightweight first-line indicator.
Mail Services
- 25 (SMTP) - Server-to-server mail relay
- 587 (Submission) - Authenticated mail submission with STARTTLS
- 465 (SMTPS) - Implicit TLS for mail submission
- 143 (IMAP) - Mail retrieval, plain
- 993 (IMAPS) - Mail retrieval, encrypted
- 110 (POP3) - Legacy mail retrieval
- 995 (POP3S) - Legacy mail retrieval, encrypted
Databases
- 3306 (MySQL/MariaDB)
- 5432 (PostgreSQL)
- 27017 (MongoDB)
- 6379 (Redis)
- 11211 (Memcached)
- 9200 (Elasticsearch)
- 1433 (Microsoft SQL Server)
- 1521 (Oracle Database)
Database ports are critical to monitor because a database failure cascades through every application that depends on it.
Infrastructure and Admin
- 22 (SSH) - Remote administration access
- 3389 (RDP) - Windows Remote Desktop
- 5900 (VNC) - Remote desktop for Linux/Mac
- 53 (DNS) - Domain name resolution
- 123 (NTP) - Network time synchronization
- 5672 (RabbitMQ), 9092 (Kafka) - Message brokers
SSH monitoring is particularly important - if SSH is down, you cannot log in to fix anything else.
Port Monitoring Best Practices
Combine With Application-Level Checks
A successful TCP handshake on a database port confirms the database is accepting connections, but it does not confirm that queries are working. For services where you need deeper validation, combine port monitoring with application-level checks: an HTTP request to a health endpoint, an API call that exercises the database, or a synthetic transaction that proves the full stack works.
Port monitoring is the first layer - fast and lightweight. Application monitoring is the second layer - slower but more thorough.
Monitor From Outside Your Network
Internal monitoring tells you the service is reachable from inside your own infrastructure, but does not tell you whether external customers can reach it. External port monitoring catches firewall misconfigurations, security group changes, ISP routing issues, and DNS problems that internal monitoring would miss.
Whenever possible, use both: external monitoring for customer-facing services and internal monitoring for backend services that should never be exposed publicly.
Be Careful About Exposing Internal Ports
If you set up port monitoring on a database or admin port, make sure your firewall only allows the monitoring service IPs through. Exposing your database port to the entire internet just so you can monitor it is a security disaster waiting to happen.
Better alternatives: monitor the database from a bastion host inside your network, or set up a dedicated health-check endpoint on your application that internally verifies the database connection without exposing it externally.
Tune Your Alerting Thresholds
Some ports occasionally drop connections due to transient network issues, especially over long-distance links. Configure your monitoring to require multiple consecutive failures before raising an alert, so you do not get woken up by single-packet glitches.
For critical services, 2-3 consecutive failed checks within a short window strikes the right balance between early detection and false-alarm tolerance.