Check reachability of your server using TCP handshake instead of ICMP.
⚠ Useful when standard ping is blocked by firewall or provider.
Helps detect service-specific downtime that ICMP ping cannot catch.
Step 1
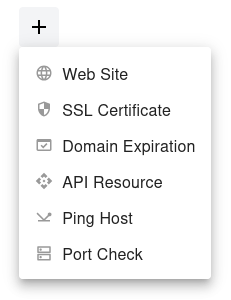
Open the dashboard, click the  button, and select Ping Host from the dropdown menu.
Step 2
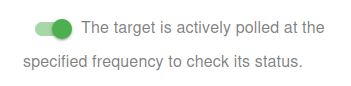
Choose whether to activate the monitor immediately or keep it paused for now:
- Active: The target is actively polled at the specified frequency to check its status.
- Paused: The target is temporarily inactive and will not be polled until set to active again.
Step 3
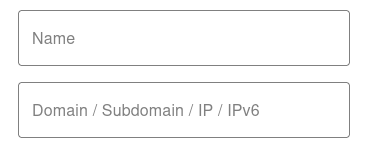
Set the Name and the Domain or IP (IPv4/IPv6) for your target. The Name will appear in alerts, reports, and notifications.
Step 4
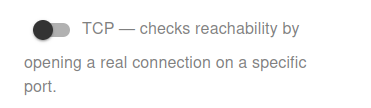
Switch the monitoring mode to TCP to check reachability by opening a real connection on a specific port. Unlike ICMP Ping, TCP checks verify that the service on the selected port is actively responding.
- Useful for web servers (HTTP/HTTPS), mail servers (SMTP/IMAP), databases (MySQL/PostgreSQL), and custom applications.
- Helps detect service-specific downtime that ICMP ping cannot catch.
- Requires specifying a valid port number to perform the TCP handshake.
👉 Make sure the chosen port is open and accessible from our monitoring network to receive accurate results.

You have now set the minimum required settings to start monitoring your resource/target.
The next steps are optional.
If you click Save, our bots are ready to start scanning and monitoring your site
Scan Frequency (Up/Down Monitoring)
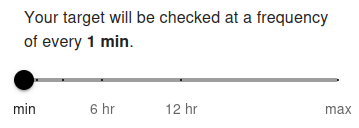
Your target port will be checked at a frequency of every 5 min by default. The minimum allowed frequency is 1 minute and the maximum is 24 hours.
The scan frequency determines how often your server or service port is tested for availability using a real TCP connection. Setting a shorter interval (e.g., 1 minute) allows you to detect service interruptions almost instantly. For free users, the minimum frequency is typically 5 minutes, while premium users can set it to 1 minute for near real-time monitoring. Frequent checks are recommended for critical services (e.g., web, mail, database, or custom application ports) to ensure fast alerting.
Longer intervals (e.g., 1 hour or more) are suitable for less critical ports or services where immediate notification is not required. Choose the frequency based on how quickly you need to respond to downtime and the importance of the monitored port.
Advanced Settings
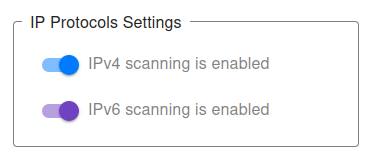
IP Protocols Settings
You can choose which IP protocols to use when monitoring your target port. By default, both IPv4 and IPv6 are allowed, and the monitoring bot will decide automatically which protocol to use.
-
IPv4 only – All TCP port checks will be performed using IPv4.
Example:
1.2.3.4:80(IPv4 address with port) will only allow IPv4 checks. -
IPv6 only – All TCP port checks will be performed using IPv6.
Example:
[2001:db8::1]:443(IPv6 address with port) will only allow IPv6 checks. - IPv4 + IPv6 (default) – Both protocols are supported, and monitoring will work for any valid domain with a port.
👉 If you provide a direct IP address with port (e.g., 1.2.3.4:22 or [2001:db8::1]:3306), the system automatically restricts monitoring to that protocol type (IPv4 or IPv6).
👉 For hostnames with ports (e.g., example.com:8080), you may explicitly choose to monitor only via IPv4 or only via IPv6.
This can be useful for:
- Testing whether your service port is accessible via both protocols.
- Ensuring IPv6 readiness for specific services (e.g., HTTPS on port 443, mail on port 25).
- Debugging connectivity or firewall issues tied to one protocol type.
For most cases, we recommend keeping the default (IPv4 + IPv6) setting, ensuring maximum compatibility and availability of your service ports.
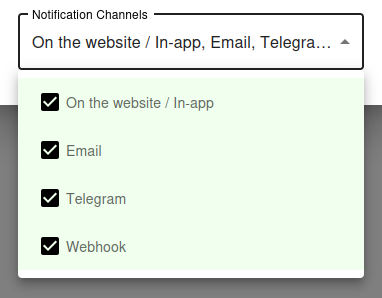
Notification Settings – Choose how you want to receive alerts
How would you like to be notified?
By default, all available notification channels are enabled:
- On the website / In-app
- Telegram
- Webhook
You can customize which channels to use for this monitor individually, or globally manage permissions for Email, Telegram, and Webhook notifications via your Notification Channels settings.
✅ Recommended: Keep all channels enabled for maximum awareness of uptime issues, but adjust according to your preferences and workflow.
TCP Ping vs ICMP Ping - When to Use Each
When ICMP Ping Falls Short
Standard ICMP ping is the simplest reachability test, but it has real limitations. Many cloud providers and security-conscious networks block ICMP entirely at the firewall, making your hosts appear "down" in ping monitoring even when they are perfectly healthy. Other networks deprioritize ICMP traffic, causing inflated latency measurements and occasional false positives.
Worse, a host can respond to ping even when its actual services are completely broken. The OS replies to ICMP at the kernel level - your web server, database, or API can be crashed for hours and ping will still show "up". This means ICMP ping monitoring alone is dangerously misleading for service health.
Why TCP Ping Is Often Better
TCP ping (also called TCP handshake monitoring) opens a real TCP connection to a specific port on the target. Unlike ICMP, this requires the actual service on that port to be running and accepting connections. If the service has crashed, the connection is refused or times out, and the monitor correctly reports the service as down.
TCP ping also bypasses ICMP-blocking firewalls - as long as the service port itself is open (which it must be for legitimate users anyway), the check works. For most production monitoring, TCP ping gives you a more accurate picture of real service health than ICMP ever could.
Common TCP Ping Use Cases
Cloud Providers That Block ICMP
Many cloud providers and managed hosting services block ICMP echo requests by default for security reasons. Standard ping monitoring against these hosts always reports "down" even though the services are running fine.
For these environments, TCP ping on a known service port (such as 22 for SSH or 443 for HTTPS) is the only reliable way to monitor reachability.
Services Behind Strict Firewalls
Corporate networks, government infrastructure, and high-security environments often configure firewalls to drop ICMP traffic completely. TCP ping works through these firewalls because it uses the same protocol that real users use to access the service.
If your target only allows traffic on specific ports, TCP ping is the right tool for monitoring its availability.
Detecting Application-Layer Failures
A crashed web server, hung database, or terminated application process leaves the host alive at the OS level. ICMP ping cannot detect these failures because the kernel still responds to packets.
TCP ping catches these immediately by attempting to open a connection on the application port. If the application is dead, the connection fails - and you get an alert before users start complaining.
Verifying Service Migrations
After migrating a service to a new host or changing port configurations, TCP ping confirms that the service is actually listening where you expect it. It catches typos in firewall rules, missed port forwards, and incorrect bind addresses that would otherwise go unnoticed until a real user tries to connect.
TCP Ping Best Practices
Choose the Right Port
Pick a port that represents what you actually care about. For a web server, check port 443 (HTTPS) or 80 (HTTP). For SSH access, check port 22. For mail servers, check 25, 587, or 993 depending on which mail service matters most.
Avoid checking ports that you do not actually expose to users. If port 22 is firewalled to admin IPs only, monitoring it from UptyBots's public IPs will fail and trigger false alarms.
Whitelist the Monitoring IPs
If your firewall is restrictive, you may need to explicitly allow UptyBots's monitoring IPs to connect to the chosen port. This is especially important for ports that are normally restricted to specific source IPs (databases, admin panels, internal APIs).
Refer to your firewall documentation or security group settings to add the monitoring IPs as an allowed source.
Combine With Application Health Checks
TCP ping confirms that the port is open and the service is accepting connections, but it does not test the actual functionality. A web server can accept TCP connections but return 500 errors on every request. A database can accept connections but return query errors.
For full service health, combine TCP ping (fast, lightweight first layer) with HTTP or API monitoring (slower but more thorough application layer). Together they give you a complete picture.
Allow for Transient Failures
TCP connections occasionally fail due to packet loss, network congestion, or transient firewall hiccups. Configure your alerting to require multiple consecutive failures before paging you, so a single dropped packet does not wake you up at 3 AM.
For most use cases, alerting after 2 or 3 consecutive failed checks gives you fast detection without false alarms from transient network conditions.